

Data Density
Role: Lead UX/UI Designer
Company: Allvue Systems
Context
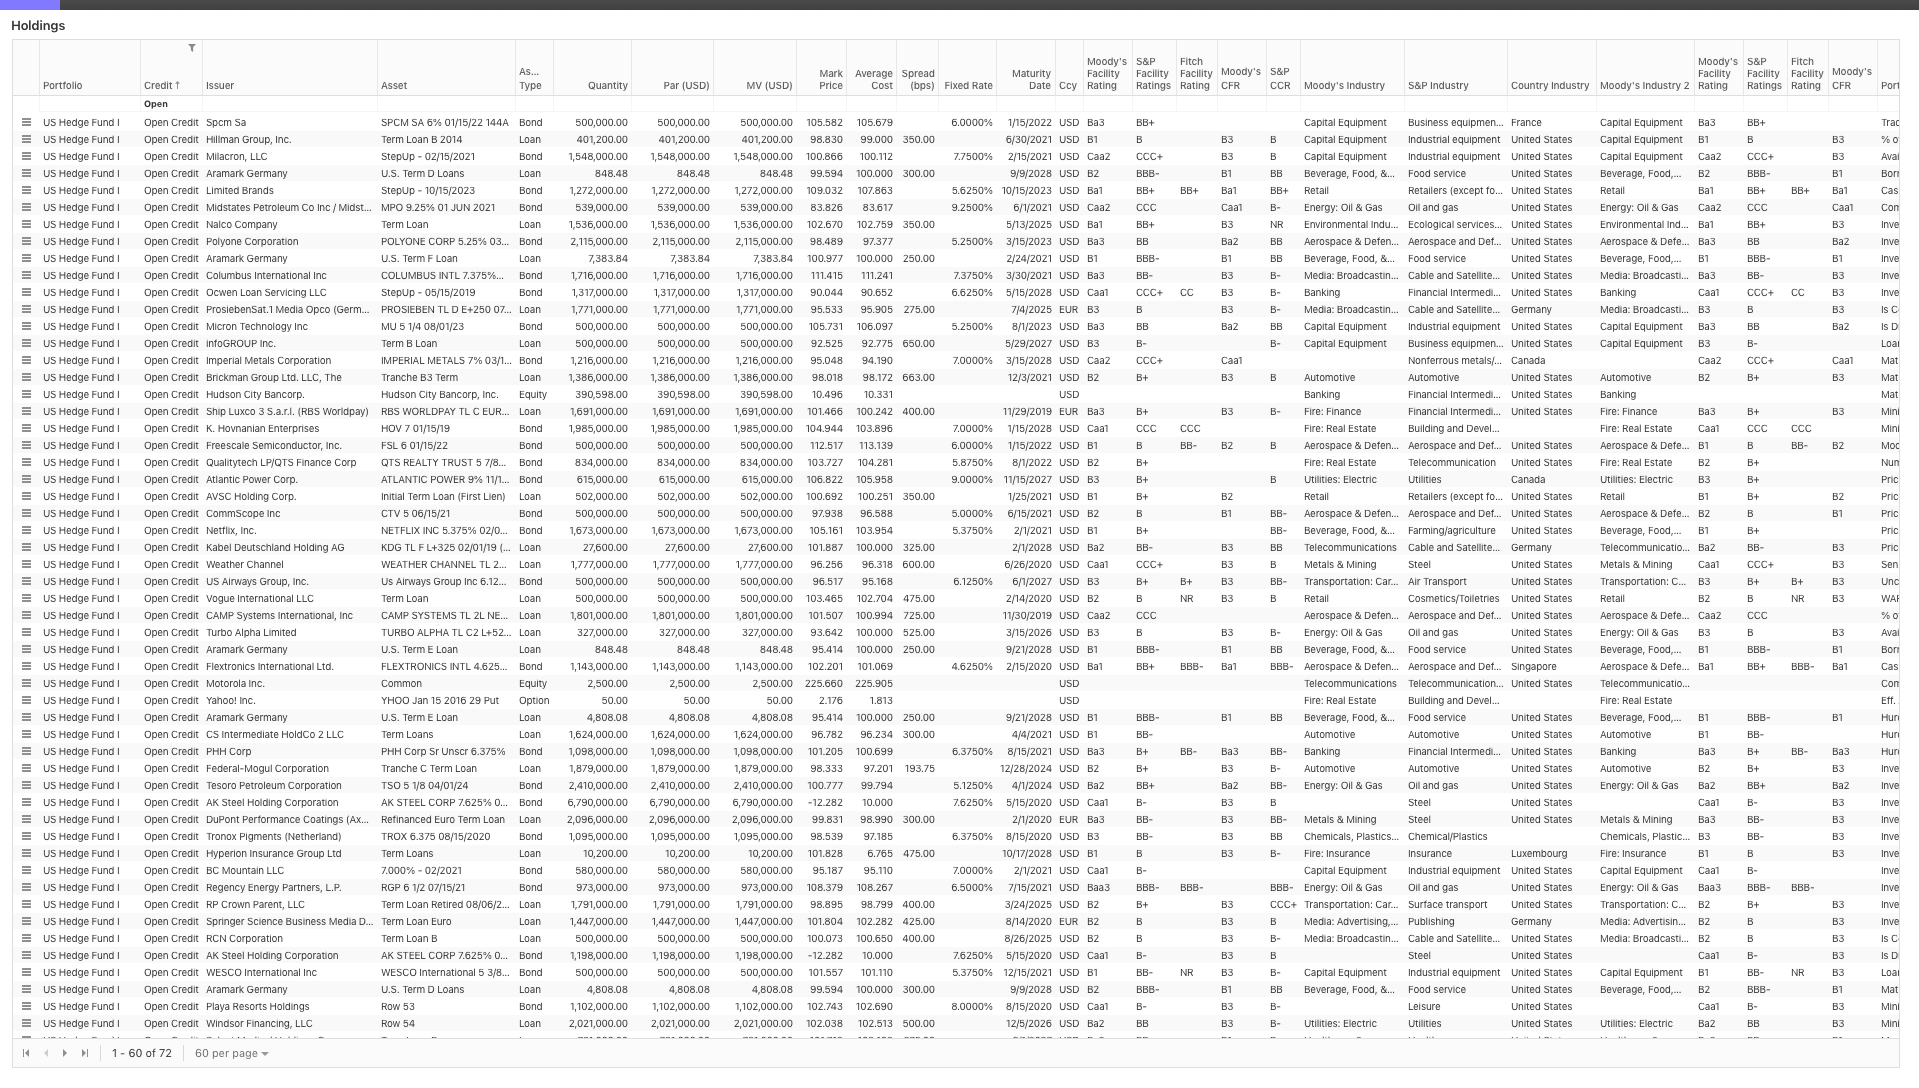
Clients using Allvue’s financial platform needed a way to view more data on a single screen. Their workflows involved dense financial datasets, and excessive scrolling slowed them down. In fintech, where speed and clarity are critical, the goal of this project was to increase on-screen data visibility while maintaining readability and usability.
My Contribution
As the UX/UI Designer, I designed a flexible system that allowed users to control how much data they see:
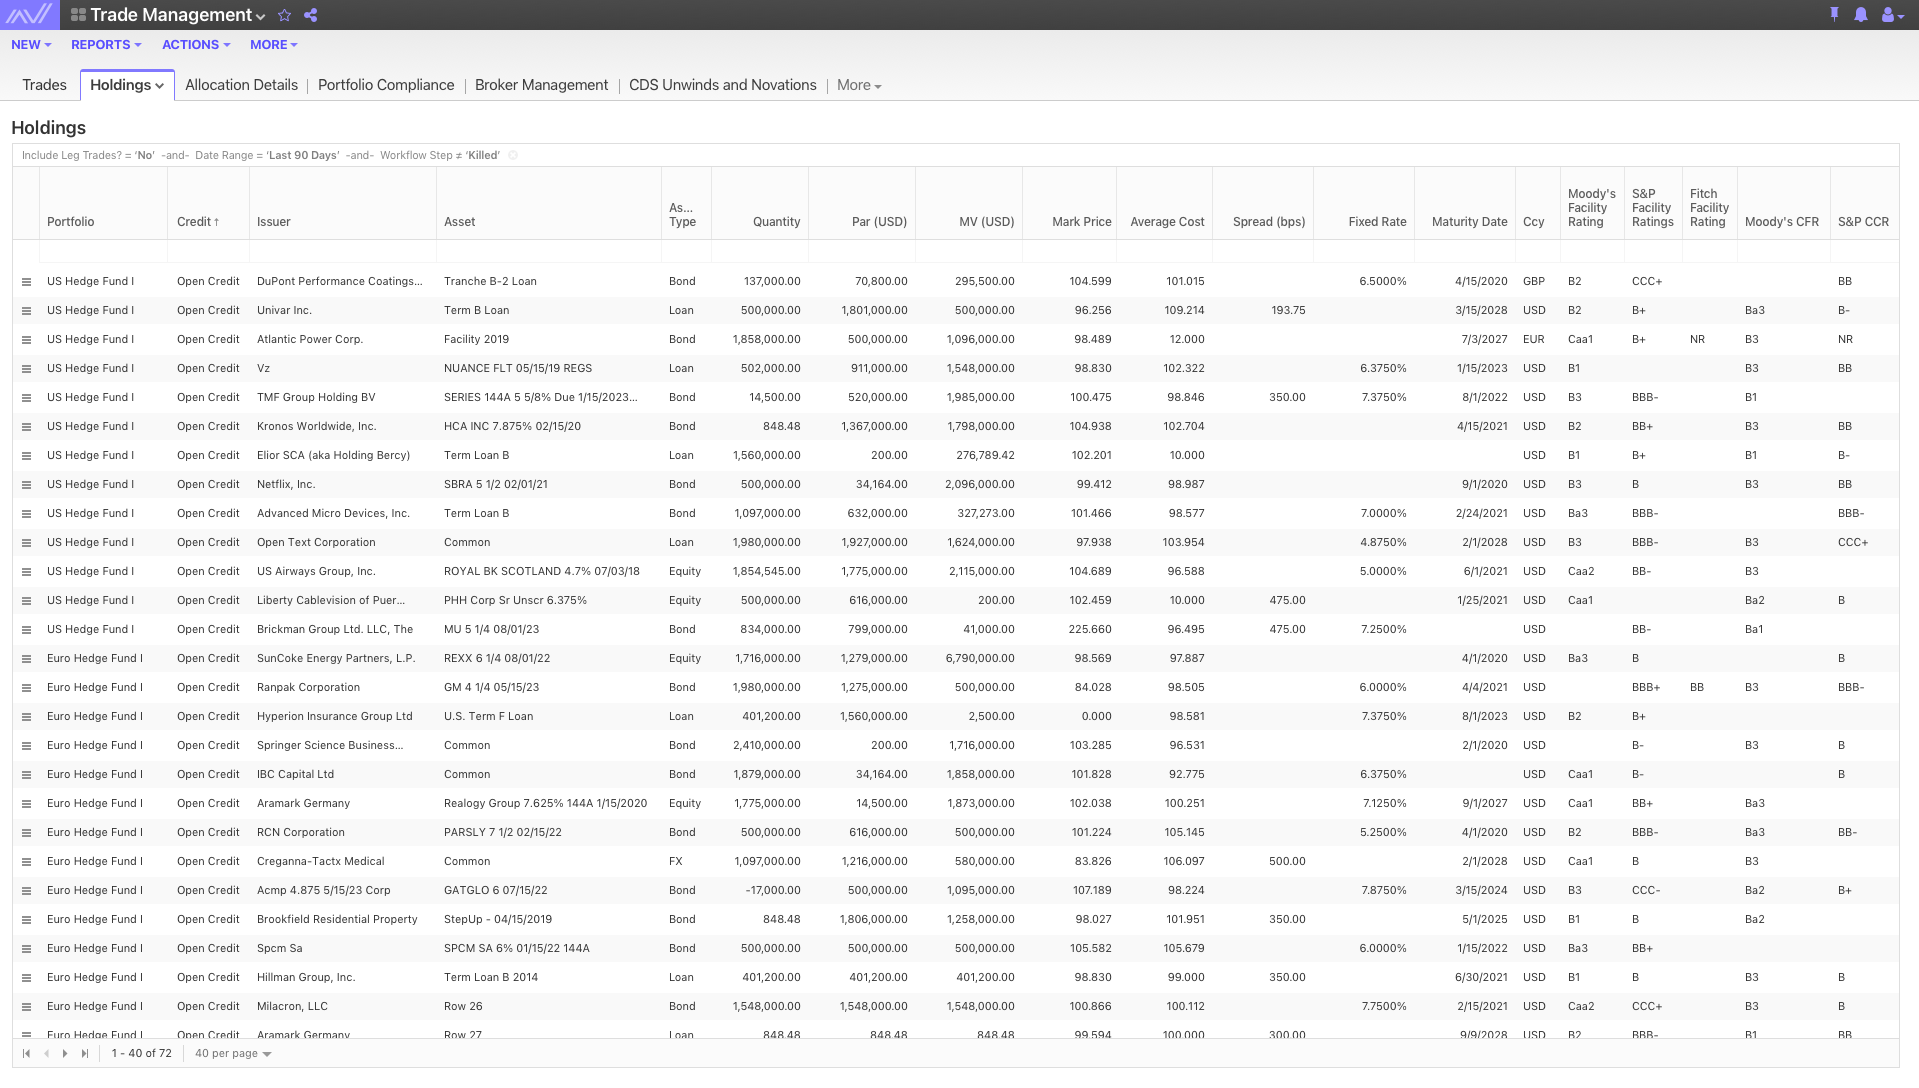
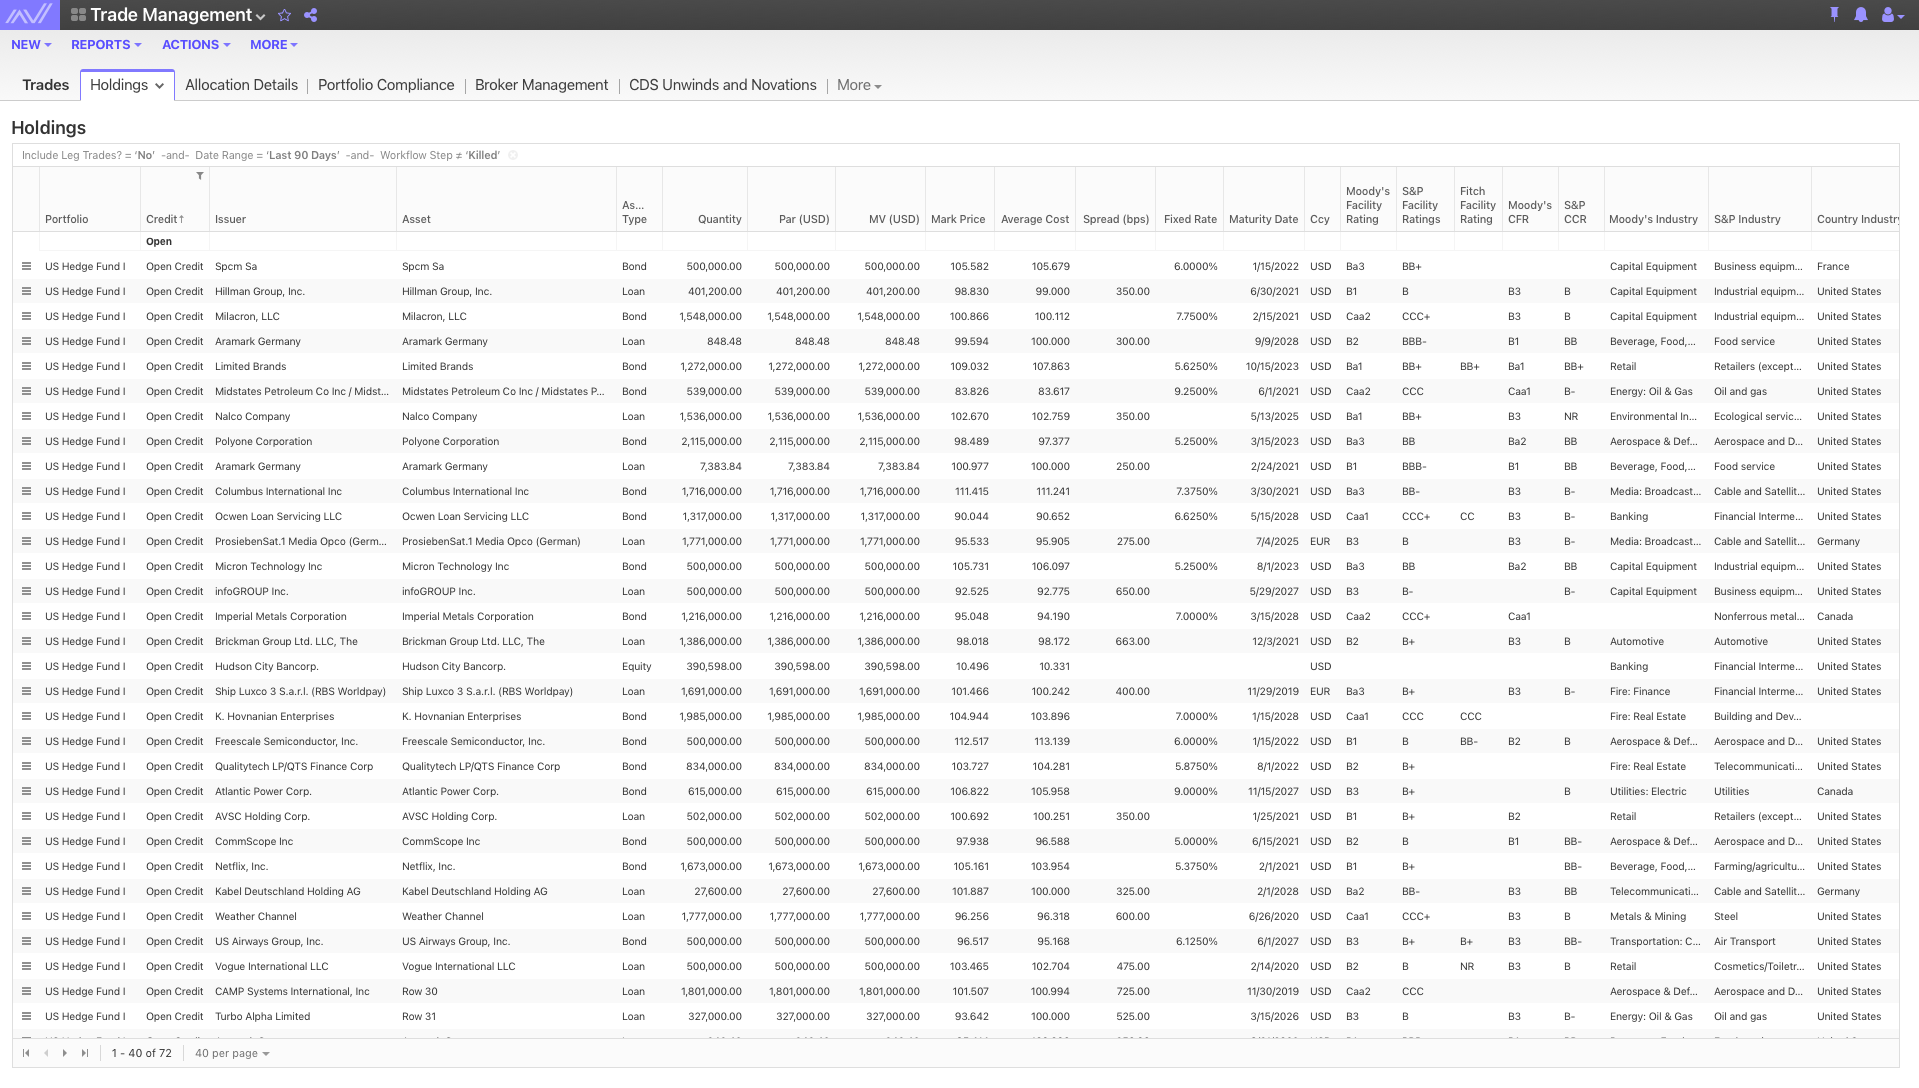
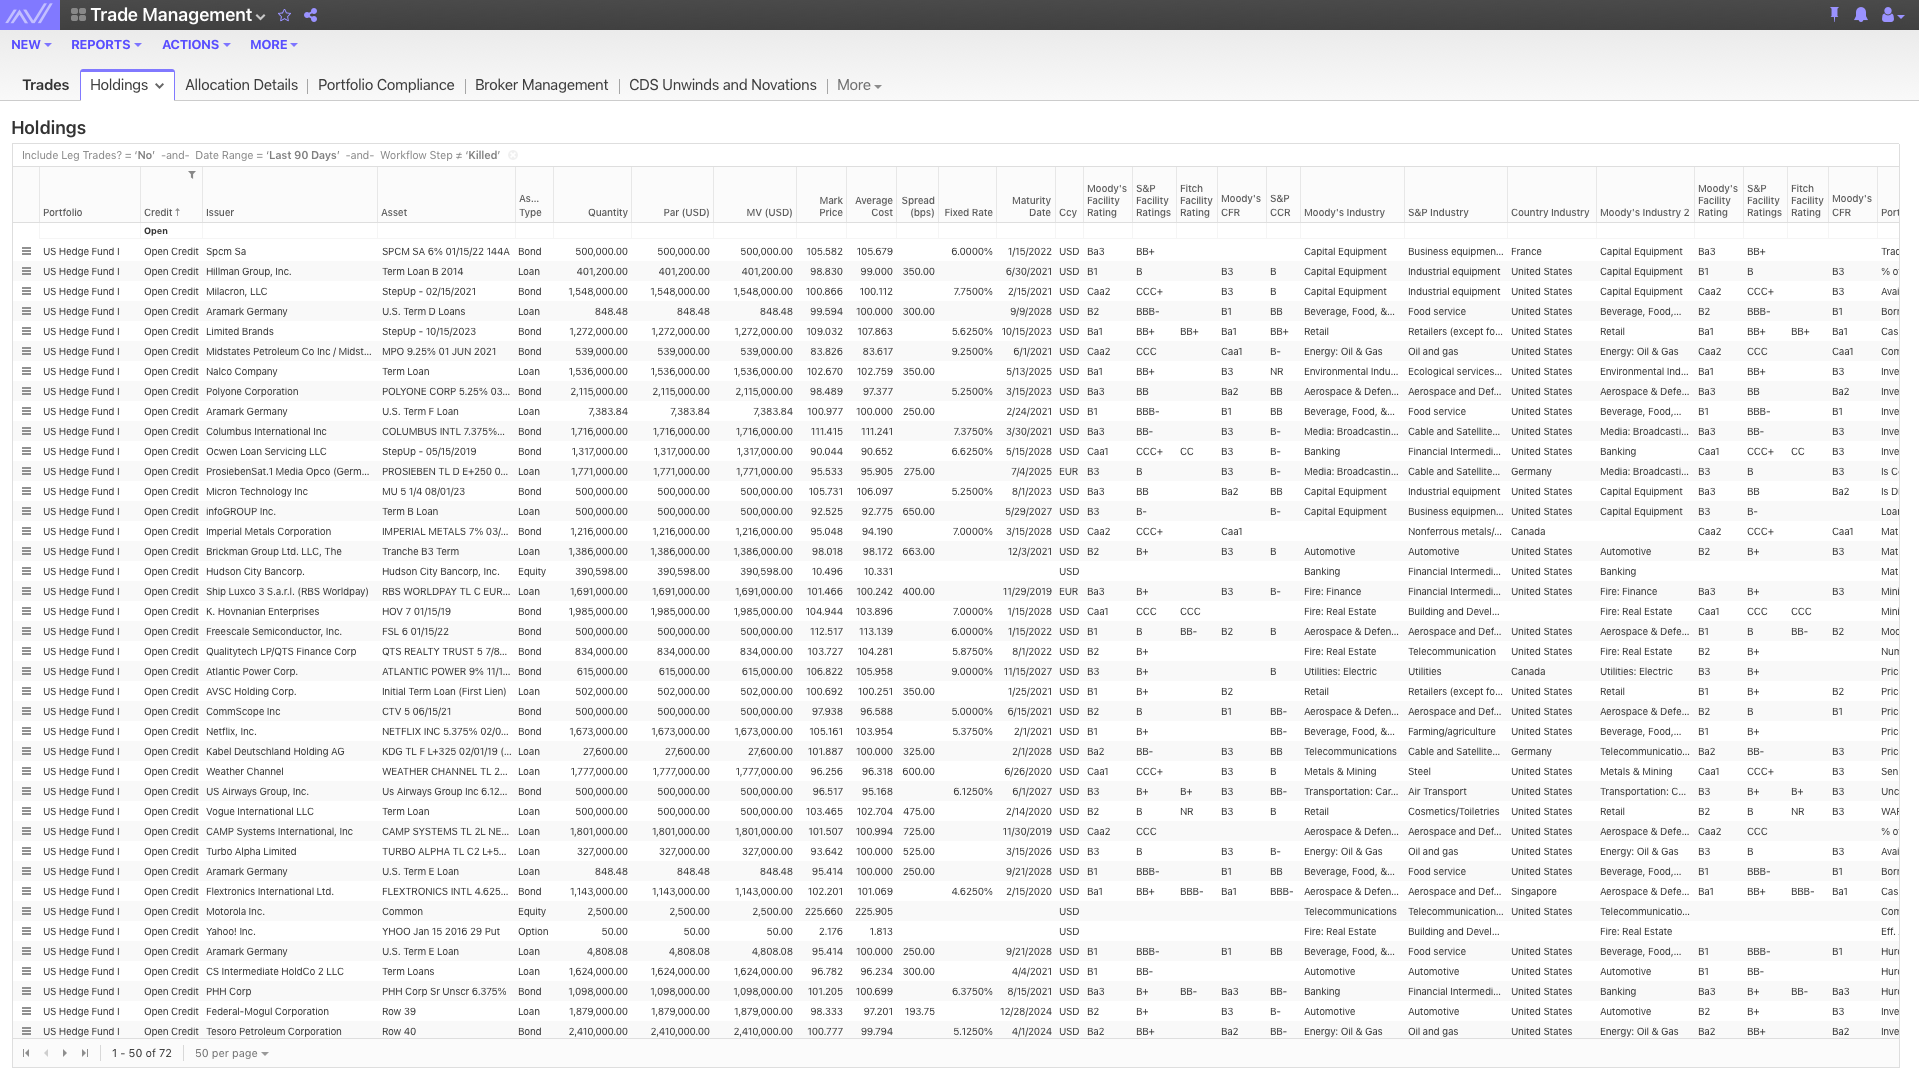
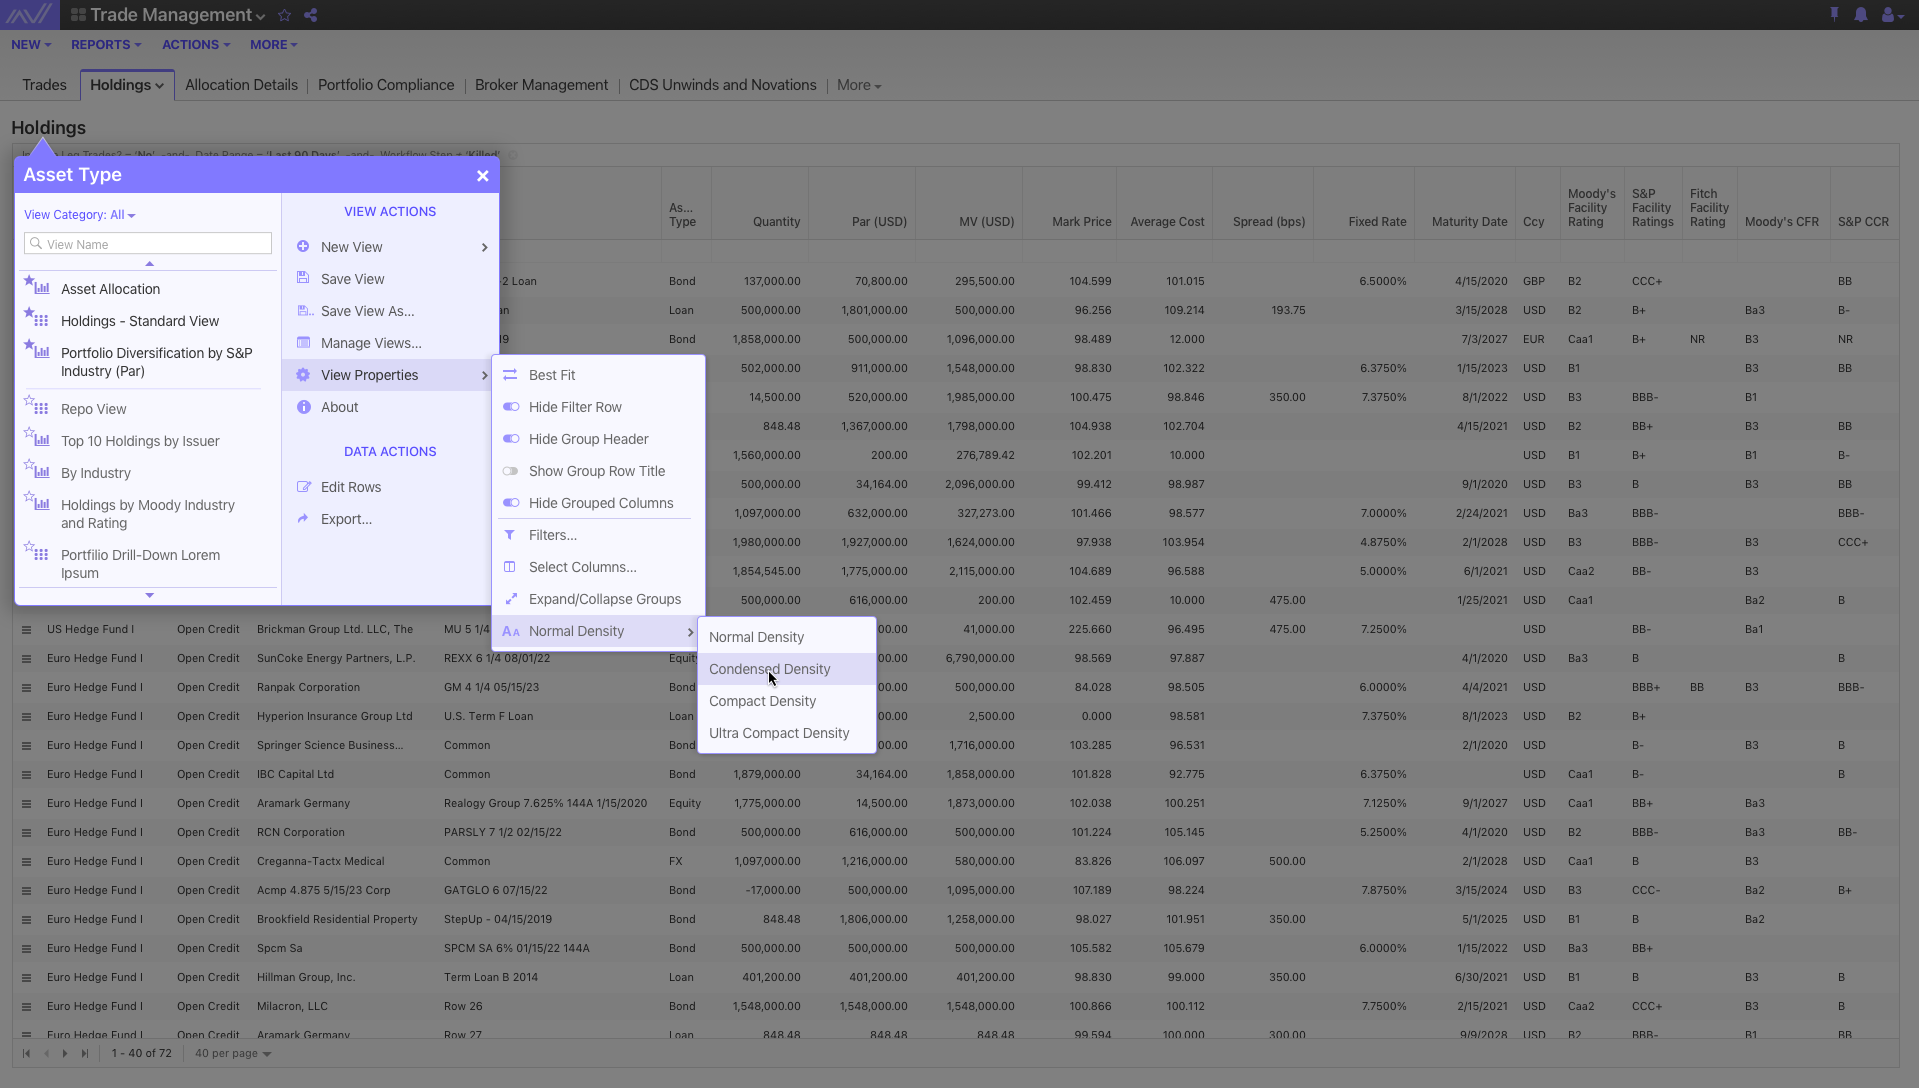
- Density Levels: Created four data density options, Normal, Condensed, Compact, and Ultra Compact, giving users control over how much information is displayed.
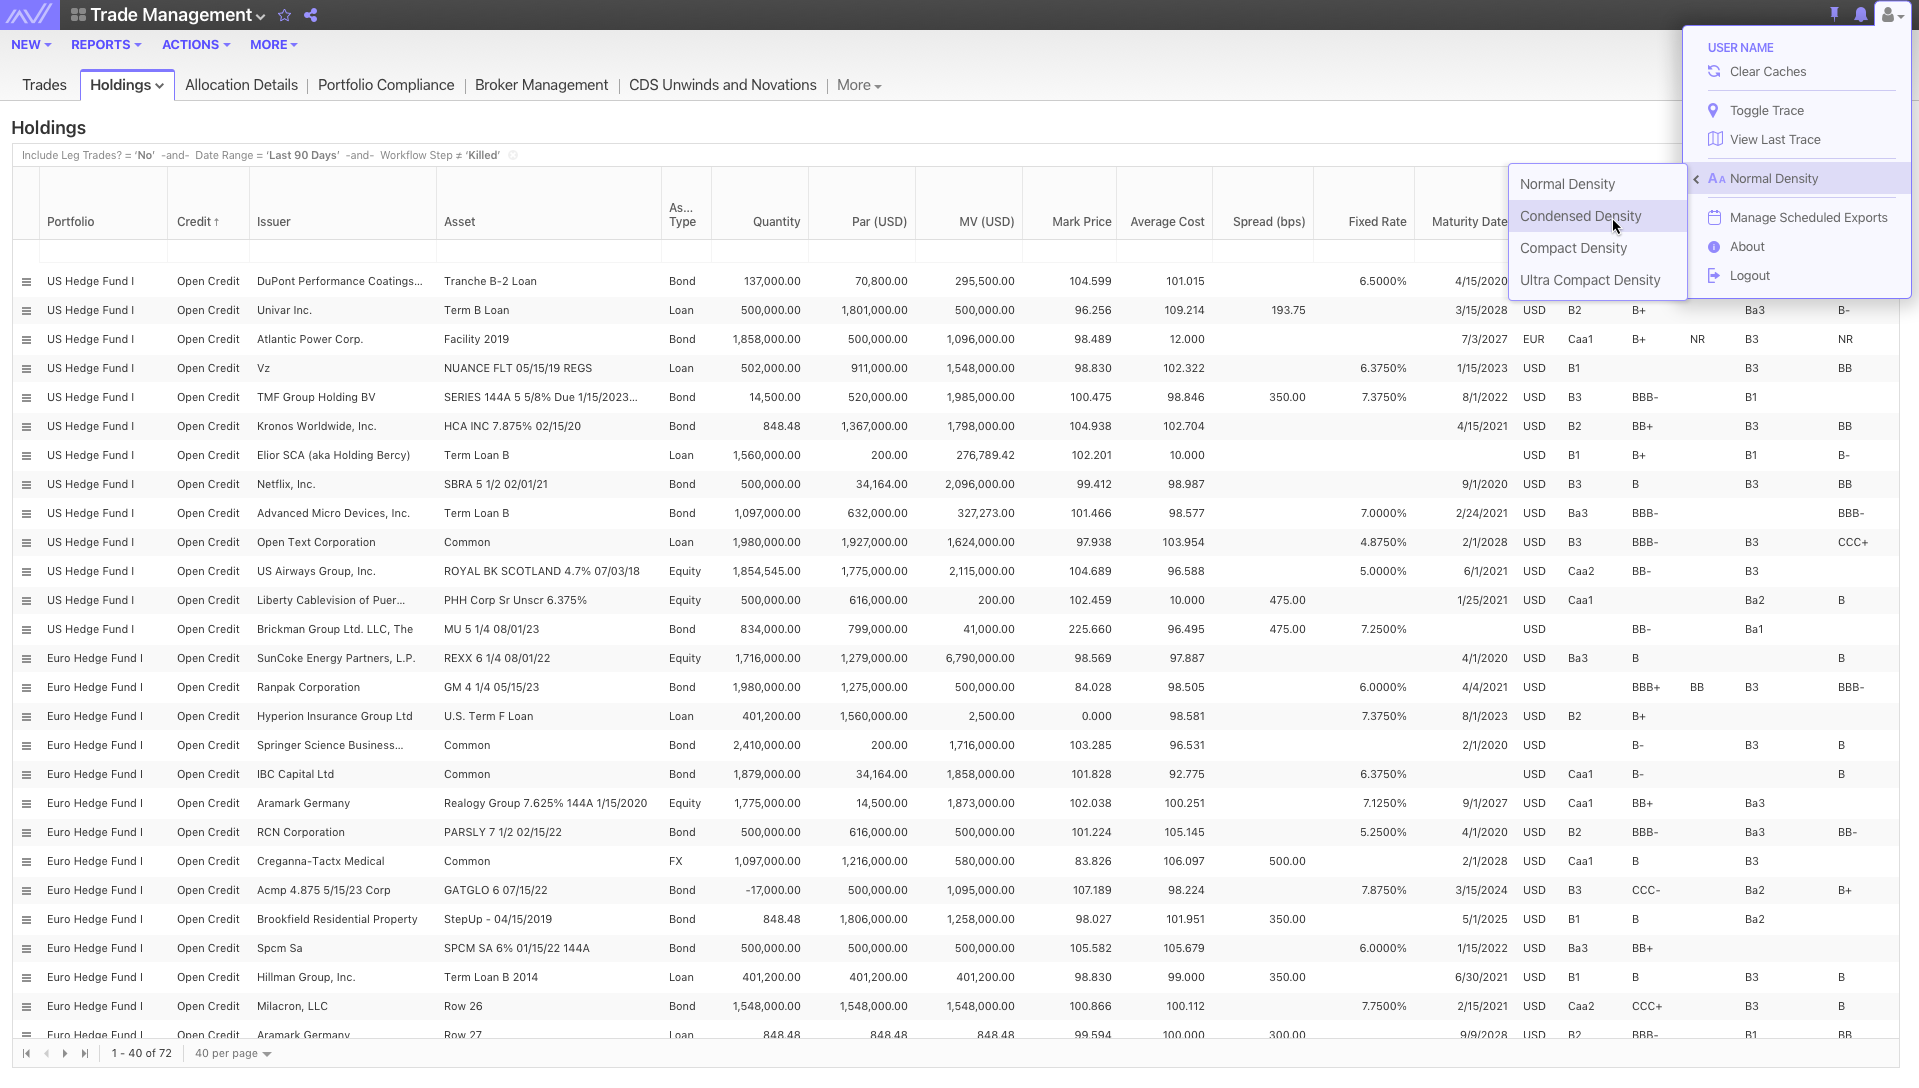
- Global & Local Controls: Designed global and local density settings, giving users flexible control over how much data they see at both the platform and widget level.
- Global: Applied across all tables via user settings.
- Local:Applied to individual table views through local settings.
Both used consistent controls so users could easily understand the difference between global and local behavior.
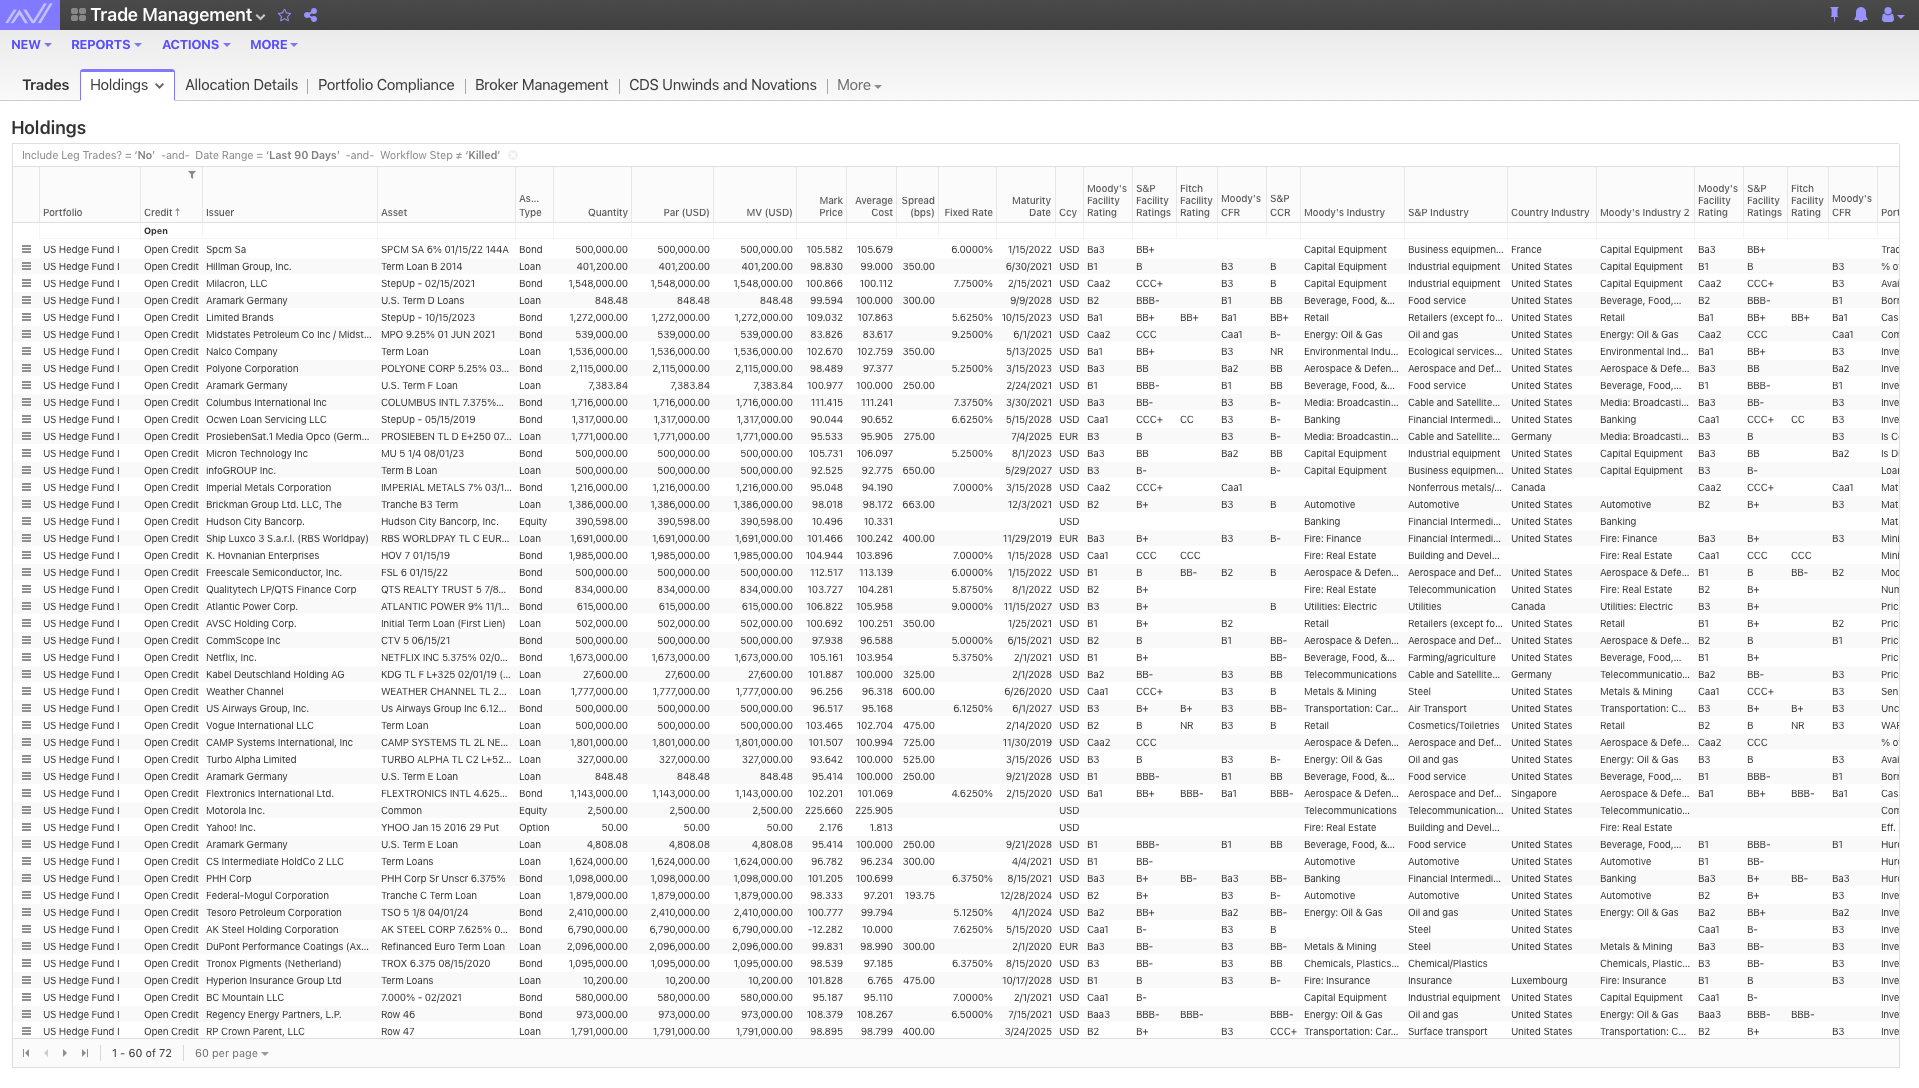
- Table Optimization: Adjusted font sizes, spacing, and layout to increase data visibility without sacrificing readability. Maintained a minimum font size of 10px, using reduced padding and margins to achieve higher density in compact views.
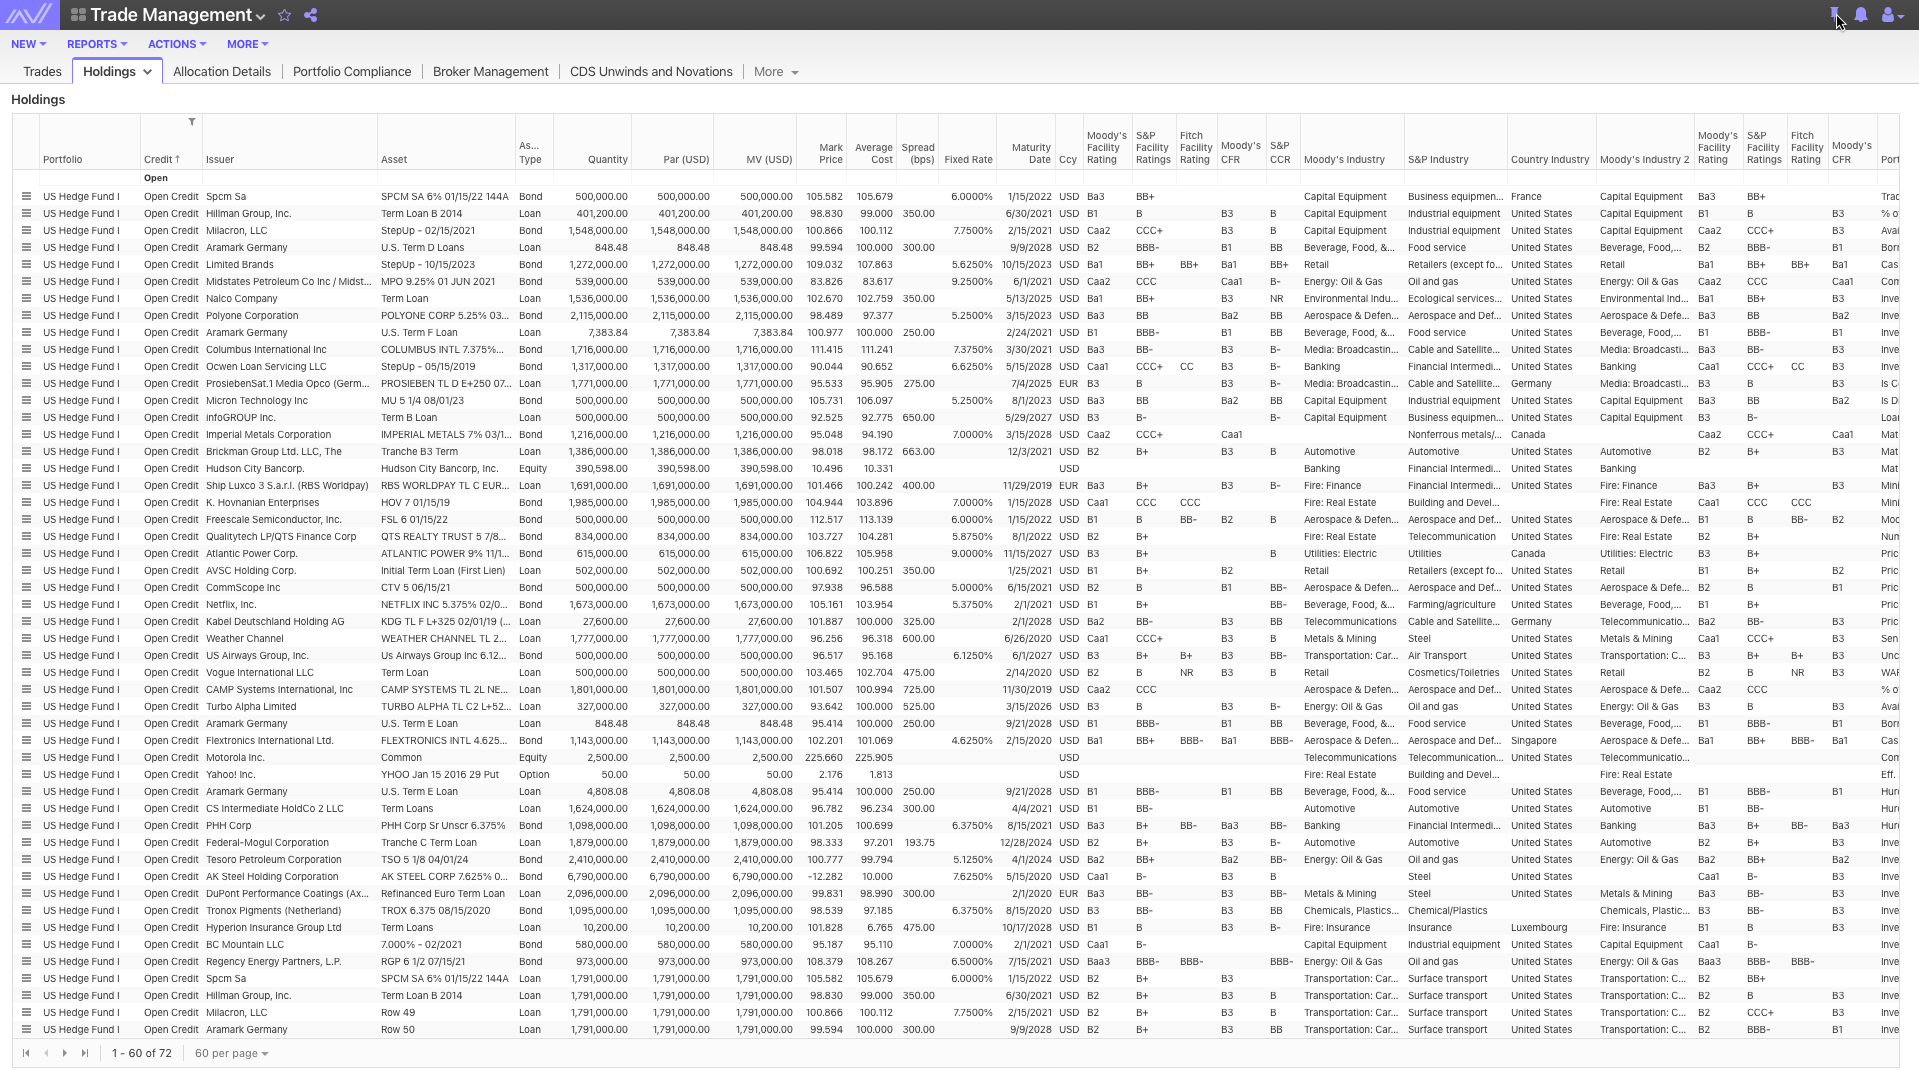
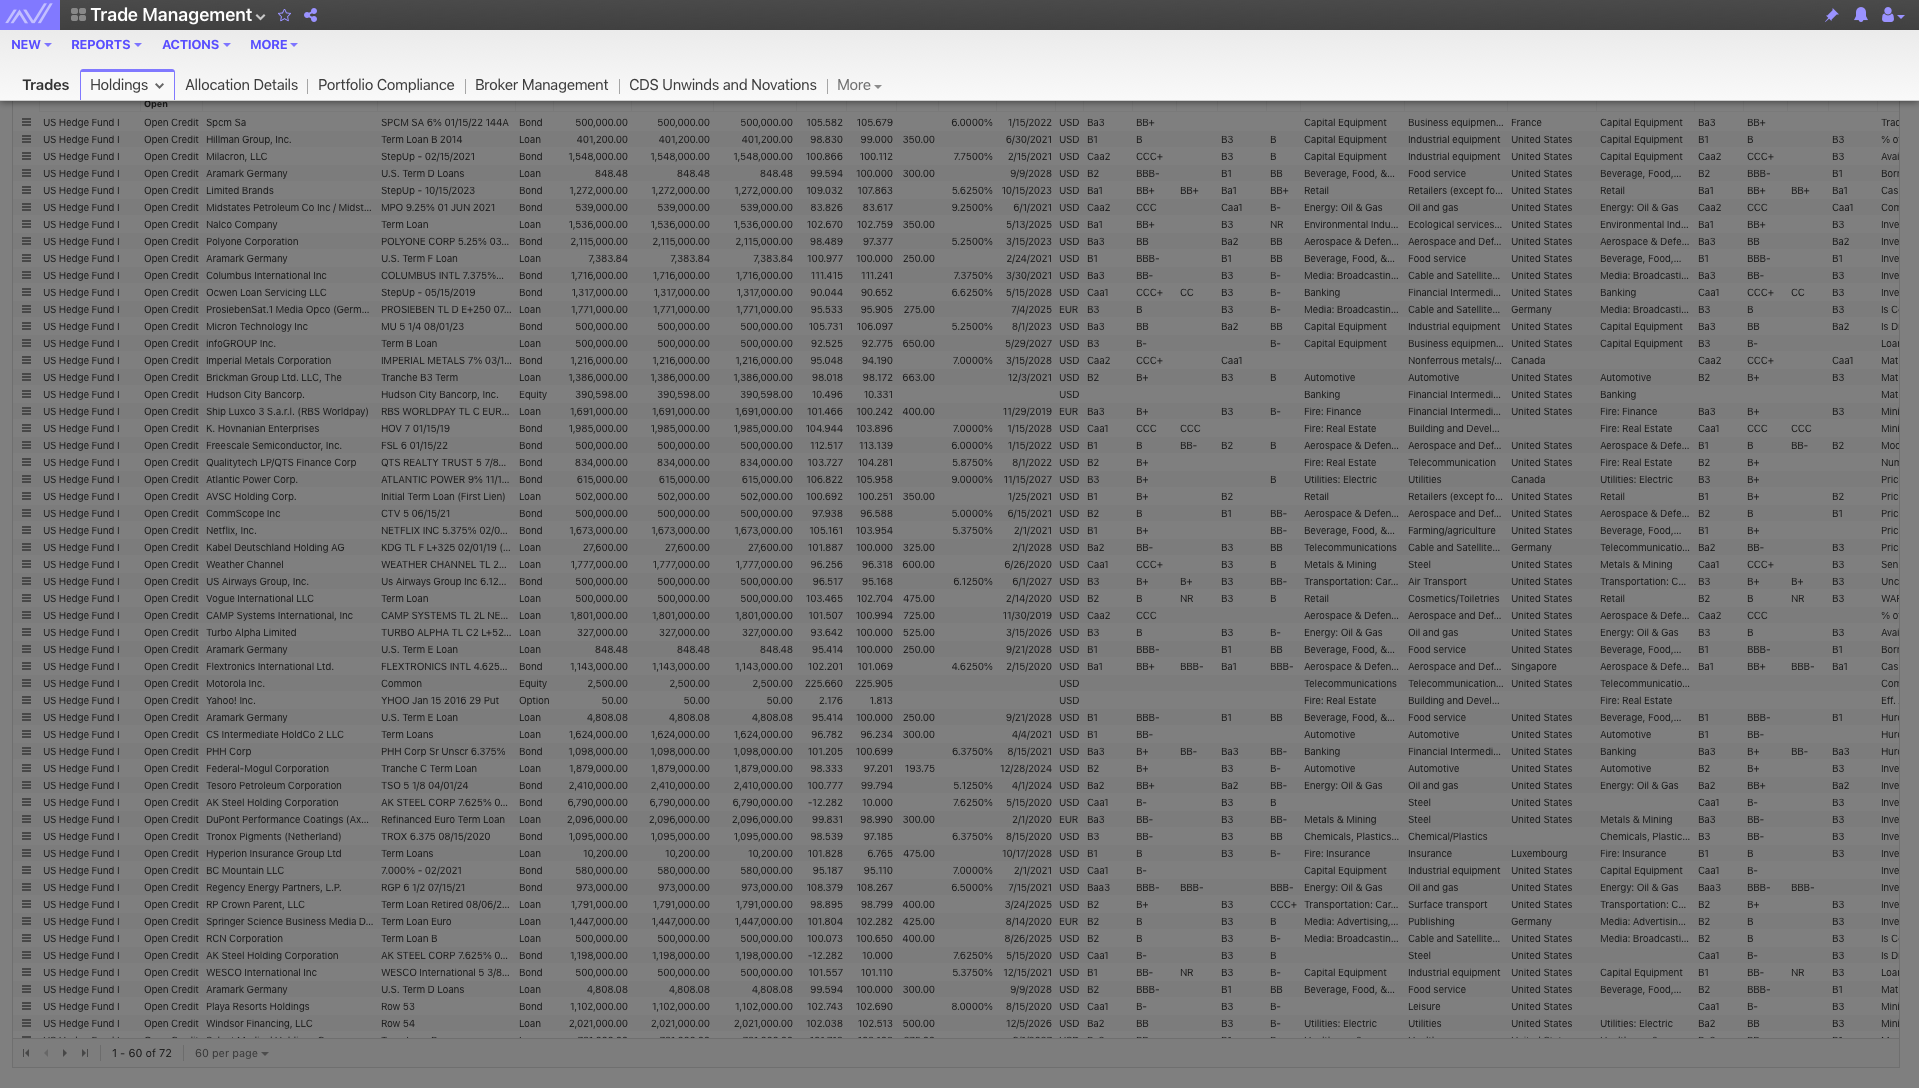
- Maximizing Screen Space: Introduced a pin and unpin interaction for the navigation and top header. When unpinned, these elements collapsed into a smaller bar and expanded on hover, freeing up more vertical space for data.
Outcome
The new data density system gave users the flexibility to tailor their workspace based on their needs, allowing them to view significantly more data without excessive scrolling. This improved efficiency for users working with large datasets and reinforced the importance of optimizing fintech interfaces for real-world, data-heavy workflows.